Create a radar chart using static data
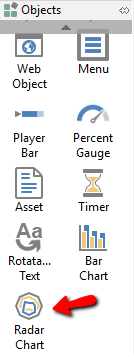
- Add a radar chart object to the page.

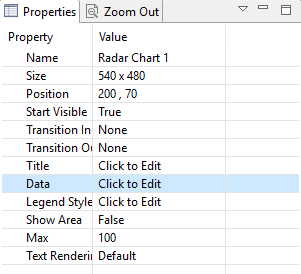
- In the Properties panel, click the Data property.

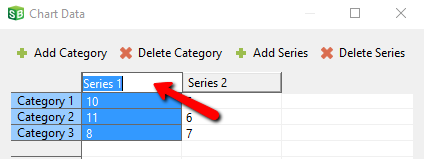
- Add or delete categories and series as needed. Add data as needed.
Note To rename a series or category name, double-click the row or column.

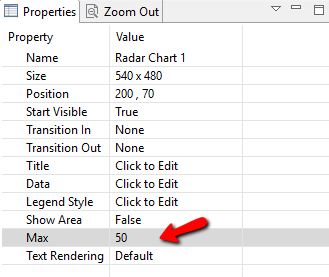
- Set the Max property to an appropriate value. Typically, you will want this to be slightly higher than the largest data value. For example, if your data is 34. 46, 19, 27, then a good Max value would be 50.

To set data dynamically, see this video.


